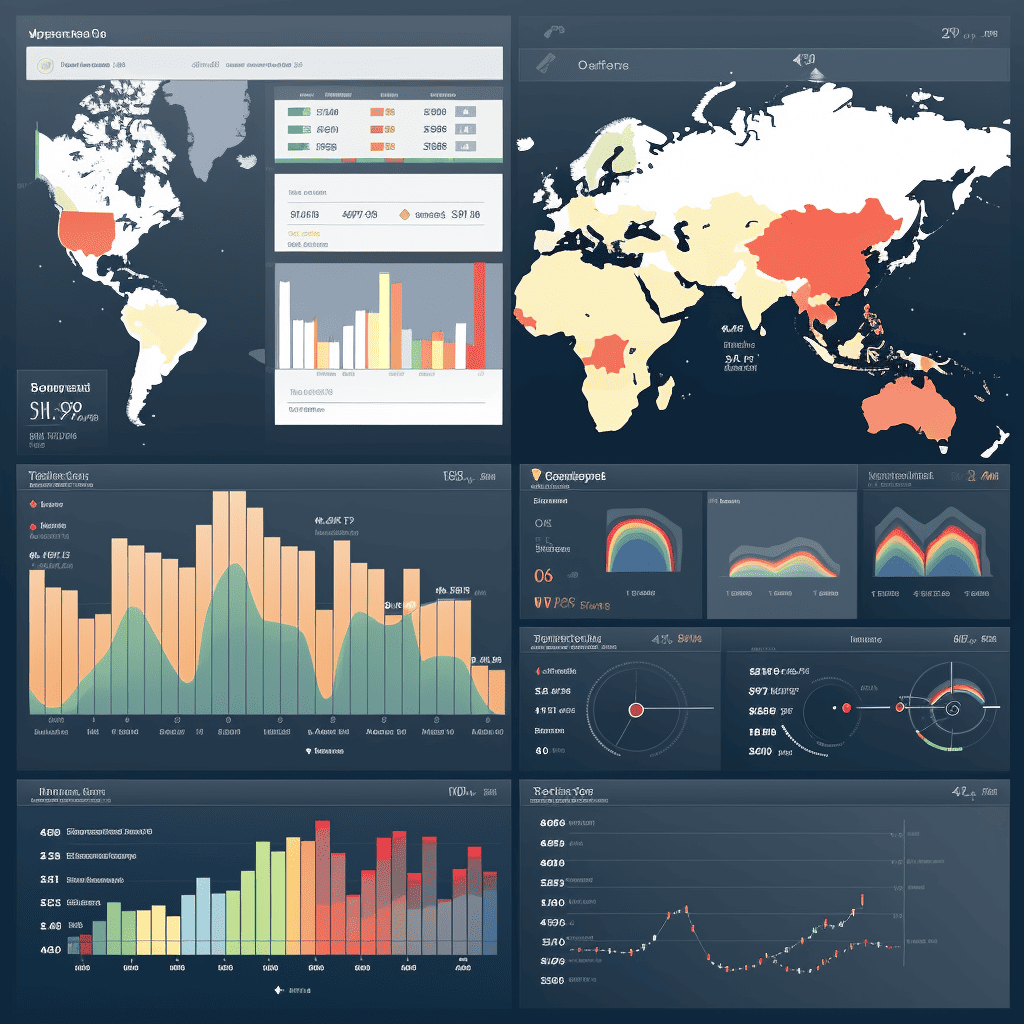
How to Create Effective Dashboards in Tableau
As the business world embraces data-driven decision-making, visualization tools like Tableau have become indispensable. Creating interactive and insightful dashboards is a fundamental skill for professionals stepping into the realm of analytics. In this detailed guide, we will walk you through the nuances of building your first dashboard in Tableau, elucidating the functionalities that make it a powerful tool in business analytics.
Understanding the Tableau Interface
Before you start Creating Dashboards in Tableau, acquaint yourself with the various facets of the Tableau interface, which comprises:
- Data Pane: Where you can find your datasets and all associated metadata. Here you can explore various data preparation and organization options.
- Workspace: The canvas where you will craft your visualizations, offering a plethora of tools to enhance your data representation.
- Marks Card: This allows you to control the aesthetics of your visualization, including color, size, and text settings.
Take time to explore and experiment with the functionalities in these sections to gain a foundational understanding
Step-by-Step Guide to Creating Dashboards in Tableau
- Connect to Your Data
Tableau offers connections to a wide variety of data sources, from simple Excel spreadsheets to complex SQL databases. Walk through the ‘Data’ menu to select and connect to your preferred data source, ensuring a seamless flow of data into your dashboard.
- Prepare Your Data
Data preparation is a critical step in the analytics process. Utilize Tableau’s data preparation tools to clean, organize, and transform your data, laying a solid groundwork for insightful visualizations.
- Create Individual Visualizations
With your data prepared, start crafting individual visualizations, known as ‘worksheets.’ Create a variety of charts including bar, line, and scatter plots, leveraging Tableau’s drag-and-drop interface to visualize different data aspects distinctly.
- Assemble Your Dashboard
Having created diverse worksheets, initiate the assembly of your dashboard. Access the ‘New Dashboard’ tab and begin adding worksheets to your canvas. Aim to create a logical flow of information, narrating a compelling data story through a well-structured layout.
- Customize Your Dashboard
Beyond just adding worksheets, Tableau offers vast customization options. Adjust dimensions, incorporate brand colors, and fine-tune alignments to achieve a professional and cohesive look. Consider adding textual annotations to provide context and enhance understanding.
- Add Interactivity
Interactivity elevates your dashboard from static to dynamic. Incorporate elements like filters, drop-down menus, and parameter controls to enable viewers to interact with the data, fostering a deeper understanding through exploration.
- Share Your Dashboard
Once your dashboard is polished to perfection, it’s time to share it with your stakeholders. Utilize Tableau Server or Tableau Online to facilitate secure and collaborative access to your insights, fostering a culture of informed decision-making.
Conclusion
Building a dashboard in Tableau is more than just a skill; it is a pathway to harnessing the true potential of data in business decision-making. This comprehensive guide provides you with the fundamentals to start your journey in Tableau, nurturing a skill set that is incredibly valuable in the contemporary business landscape.
With a robust understanding of Tableau’s functionalities, you are now prepared to create dashboards that not only narrate a data story but also facilitate intelligent business strategies through actionable insights. Remember, the journey of learning never ceases; keep experimenting, evolving, and advancing your skills with each dashboard you create.
Let's Take Your Tableau Skills to the Next Level Together!
You’ve got a good grasp of the Tableau fundamentals – it’s time to explore even deeper. Remember, the CloudFruit team is right here with you on this journey to mastery.
Got questions or facing hurdles? Maybe you’ve created your first dashboard and you’re eager to share it with someone? We’re all ears! Reach out to us for a chat where we can swap insights, offer advice, and even share some top-secret Tableau tips.
Reach Out to Us at CloudFruit (Let’s link out to our chat page) – Let’s build a community where curiosity meets expertise.
We’re excited to see the amazing dashboards you’ll create!


